If you know how to read asset charts, you can try out this strategy. Candlesticks show you a lot of information about how the asset behaves over time. The candlestick’s bottom is the lowest price it hit, and its top indicates its highest price.
You can also see the asset’s opening and closing price between the top and the bottom of the candlestick. In this strategy, you must observe the asset’s price over time.
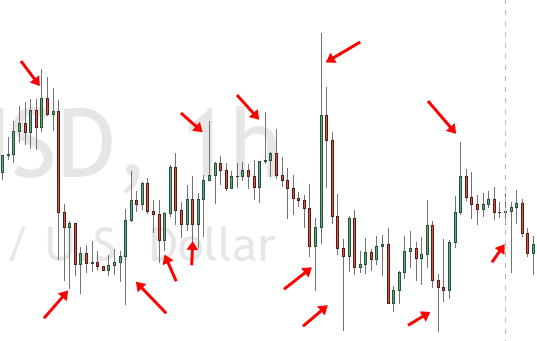
You will start to see formations that repeat over time, which will reveal the potential movement of the price in the future. Typically, you will see long candlesticks on the ends of the asset chart (“mountains”) and a collection of short candlesticks in between them (“valley”).
How to apply
If you see that the candlesticks of an asset are taller and the price is experiencing a peak, you can expect the price to fall soon. On the other hand, if you see a trough of candlesticks, you can expect the price to rise.
These mountains and valleys often appear over months. You can set expiry times by looking at the frequency of a mountain and valley appearing to make a profit.