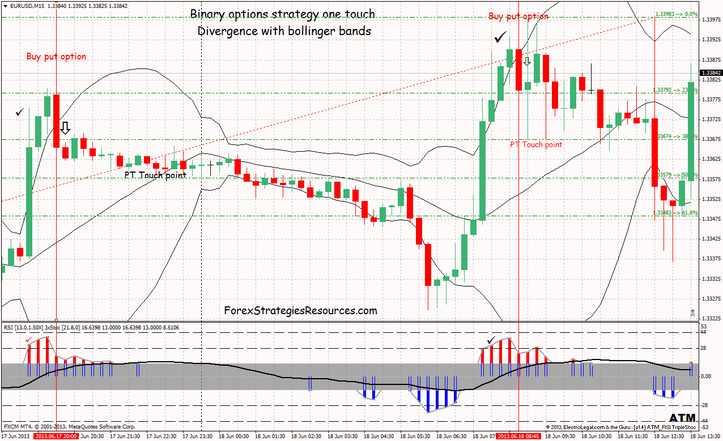
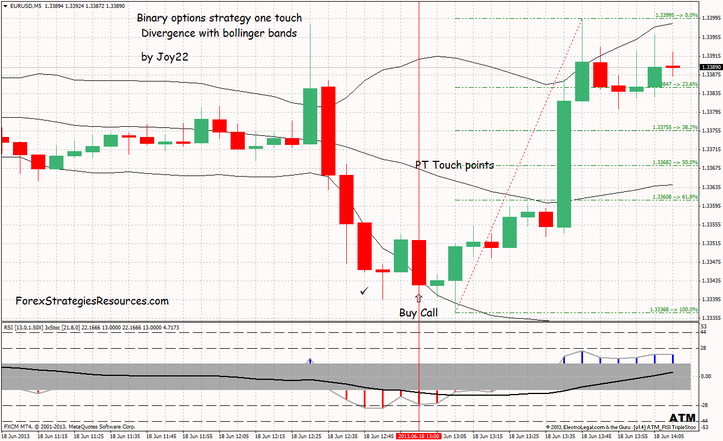
Binary options divergence strategy with Bollinger bands
Divergence Method of the trading.
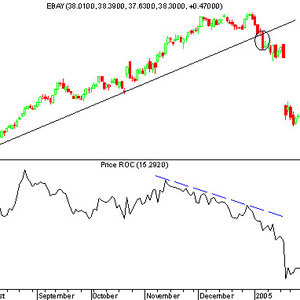
What 's divergence?
In an up trend that will setup as a bearish trade, you 'll see the price making higher highs but you'll see the indicator making lower high.
In opposite direction?
In an up down taht will setup as a bullish trade, you 'll see the price making lower lows but you'll see the indicator making higher low.
Time Frame 5 min= Time expire 60 min.
Time Frame 15 min= Time expire 180 min.
Metatrader indicators:
ATM RSI Histo Triple Stochastic Divergence indicator;
Fibonacci Retracement: XIT Fib indicator.
The price should be above the upper Bollinger Bands indicator in case of a bearish divergence and in the same manner the price should be below the lower Bollinger Bands indicator in case of a bullish divergence.
When the bullish divergence is spotted (time frame 5 min), it is a signal for buying a 1 hour call option.
Buy When the red bars of the indicator ATM RSI Histo Triple Stochastih Divergence retrace below the dotted black line.
Touch points are the Fibonacci Retracement: XIT Fib indicator.
In the same manner when a bearish divergence is spotted (time frame 5 min), it is a signal for buying a put option.
Sell When the blue bars of the indicator ATM RSI Histo Triple Stochastic Divergence retrace below the dotted black line.
Touch points are the Fibonacci Retracement: XIT Fib indicator.
This method of trading based on divergence can also be applied to Binary options strategies High / Low but this method of trading is not for beginners.